CHIA Publishes Annual Hospital and Health System Financial Performance Report

DATE: September 23, 2021
The Center for Health Information and Analysis (CHIA) announces the release of the Annual Massachusetts Acute Hospital and Health System Financial Performance Report for fiscal year (FY) 2020. This report incorporates the financial impact of COVID-19 on hospitals during FY 2020, including the distribution of federal COVID relief funding as part of the Coronavirus Aid, Relief, and Economic Security (CARES) Act starting in April 2020, as well as the distribution of state relief funds.
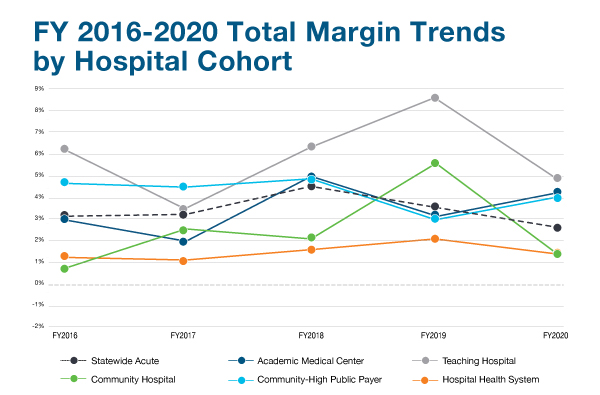
This publication reports on the profitability, liquidity, and solvency of hospital health systems and their affiliated acute hospitals, as well as the profitability of affiliated physician organizations and health plans. It also includes a comparison of the performance of four hospital cohorts (academic medical centers, teaching, community, and community-high public payer) on each metric over a five-year period, fiscal years 2016 through 2020.
Key Findings
- The statewide median acute hospital total margin was 2.6%, a 0.9 percentage point decrease from FY 2019, while the statewide median acute hospital operating margin was 1.3%, a 1.2 percentage point decrease from FY 2019. These margins include $2.1 billion in COVID-19 relief funding reported as operating revenue.
- Federal and state COVID-19 relief funds received by hospitals had significant impacts on their reported operating revenue and income. If these COVID-19 relief funds had not been distributed, all hospital cohorts would have experienced negative median total margins. Additionally, the statewide median acute hospital total margin would have been -4.5% without COVID-19 relief funds.
CHIA is also releasing with this report an interactive dashboard containing information on five-year trend analyses for each acute hospital and their hospital health system. This report is also accompanied by the databook used to calculate these metrics and a technical appendix.

