Total Health Care Expenditures, Total Medical Expenses and Alternative Payment Methods
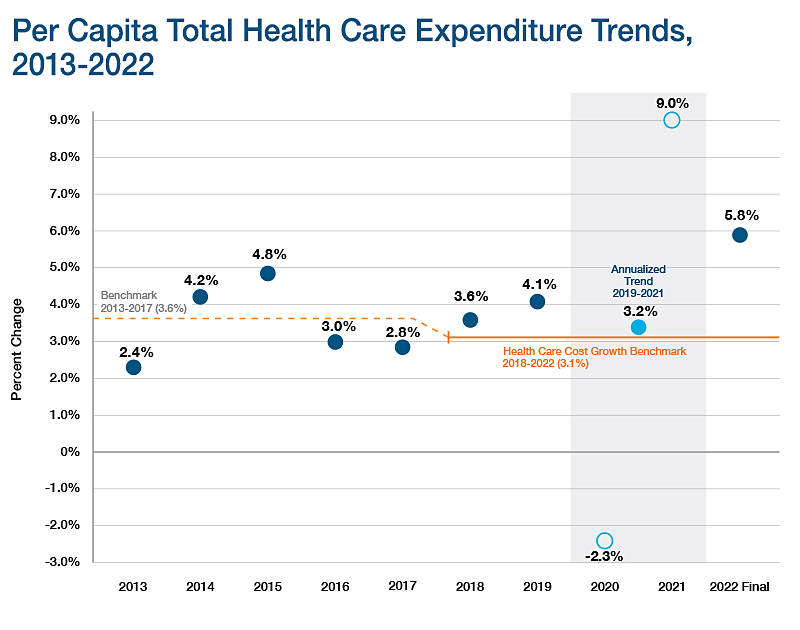
Key Annual Report THCE Metric
(Click to enlarge)
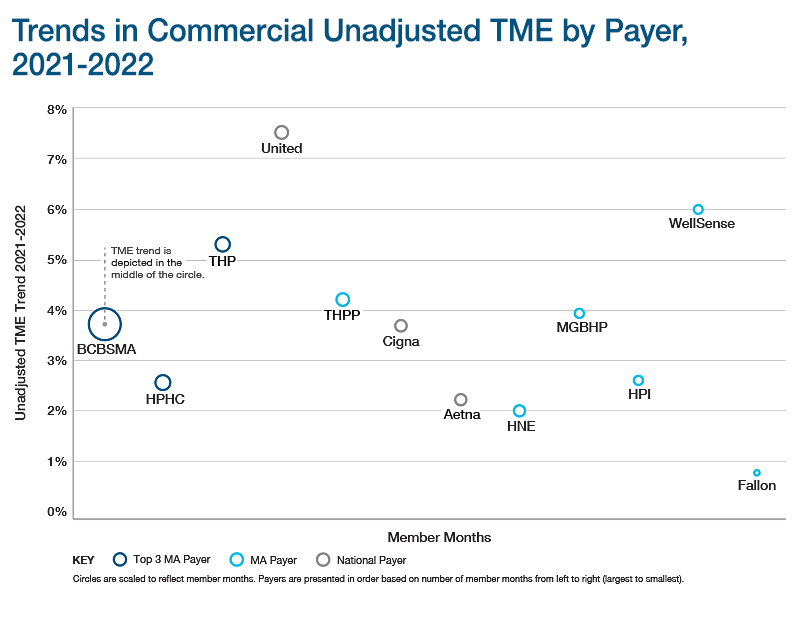
Key Annual Report TME Data
(Click to enlarge)
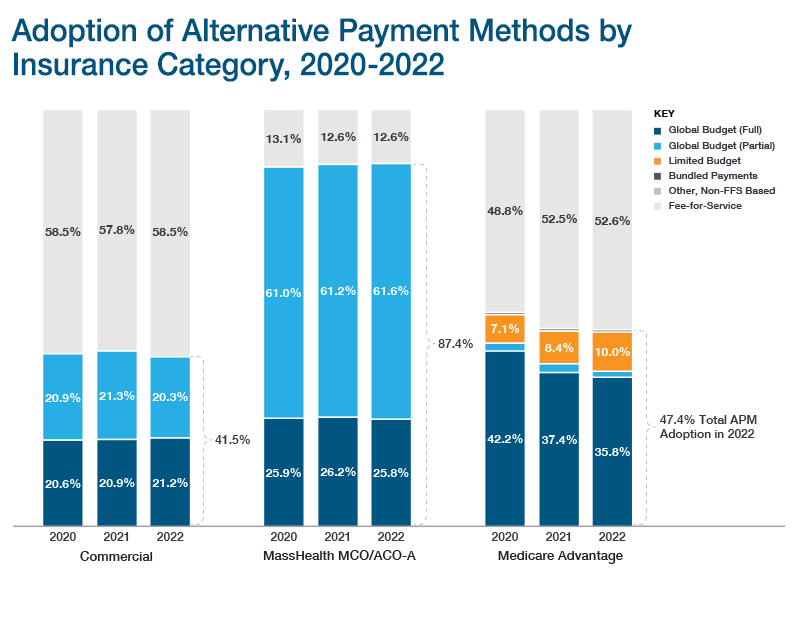
Key Annual Report APM Data
(Click to enlarge)
CHIA monitors health care spending by public and private payers in Massachusetts using three key metrics:
- Total Health Care Expenditures (THCE)
- Total Medical Expenses (TME)
- Alternative Payment Methods (APMs)
These measures are all reported in CHIA's Annual Report on the Performance of the Massachusetts Health Care System.
Total Health Care Expenditures (THCE)
THCE compares actual health care cost growth with the growth benchmark set by the Health Policy Commission. This measure of total health care spending in the Commonwealth includes:
- All categories of medical expenses paid to providers
- All non-claims-related payments to providers, such as performance payments
- Member cost-sharing payments to providers, such as deductibles, co-payments, and co-insurance
- The net cost of private health insurance
Total Medical Expenses (TME)
TME represents the full amount paid to providers for health care services delivered to a payer’s member population, expressed on a per member per month (PMPM) basis. TME includes the amounts paid by the payer and patient cost-sharing, and covers all categories of medical expenses and all non-claims-related payments to providers, including provider performance payments.
Alternative Payment Methods (APMs)
Alternative payment methods (APMs) are payment arrangements in which some of the financial risk associated with delivering medical care and managing health conditions is shifted from payers to providers. Generally, APMs are intended to give providers new incentives to control overall costs (e.g., reduce unnecessary services and provide services in the most appropriate setting) while maintaining or improving quality. The most common APMs in Massachusetts are global budgets, which establish spending targets for a comprehensive set of health care services to be delivered to a specified population.
While fee-for-service remains the dominant type of payment method utilized in the Commonwealth, APMs have been implemented in recent years among a cross-section of the commercial, Medicaid, and Medicare populations.


